
Strategically Using Data to Drive Academic Outcomes
Meadowview Charter School (used throughout as a pseudonym) is a Pre-K - 8th grade school serving over 700 students in the Midwest. 97% of Meadowview’s students are minority, and 100% qualify for free or reduced price meals. Meadowview focuses on developing leadership skills, growth mindsets, and cultural competencies within its student body to complement and supplement their academic programs. EdOps began working with the school in the 2018-2019 school year.
Committing to Student Improvement Goals
In the 2017-2018 school year, 26% of 3rd - 8th grade Meadowview students scored Below Basic in ELA and 38% scored Below Basic in Math on the state assessment. Leading up to the start of the 2018-2019 school year, Meadowview Charter School committed to providing enhanced levels of support to these students. The school’s leaders knew that students performing at the Below Basic level were those furthest from engaging with rigorous content, and that as a result, those students were most at risk of falling - and staying - behind.
School leadership decided that any academic goals would center on improving learning for individual students, rather than on striving to move only those students “on the bubble,” i.e., students on the verge of earning higher achievement levels such as Basic, Proficient, or Advanced. Their goals would revolve around increasing students’ ability to access grade-level content and higher levels of rigor, and not just improving the school’s achievement levels.
Over the summer, the school’s Executive Director met with the elementary and middle school principals to develop an action plan. With the addition of reading and math interventionists to their staff for the upcoming school year, the ED and principals felt confident they had the capacity needed to focus on their Below Basic-scoring students; however, they knew that additional staffing alone would not be all they needed to be successful.
School leadership identified that they also needed clear data systems to track progress toward their goals and to provide transparency and accountability along the way. Investing further in their data program was a critical next step. Specifically, they decided to focus on the following objectives:
Identify the right students for enhanced support;
Use interim assessment results to isolate specific skills in order to build targeted instruction/intervention lessons;
Design progress-monitoring feedback structures so that instructional leaders could better visualize outcomes and make adjustments;
Monitor goal progress at the end of each data cycle to provide insight and accountability at all levels of the organization.
While Meadowview already had proven interim assessments and a clear data philosophy, to pursue these ambitious goals, they also needed the right data management techniques, measurement methods, analytical abilities, and reporting structures. The school partnered with EdOps to meet these needs.
Below we describe how Meadowview Charter School and EdOps worked together to develop specific data methods, processes and priorities to support the achievement of the school’s 2018-2019 academic goals. We’ve provided context on how we tackled the issues together, as well as what was learned along the way.
Data Objectives Supporting Student Improvement Goals
Before jumping into data program adjustments, school leadership communicated to all staff the two goals as the highest priorities for the coming school year:
ELA Below Basic levels (3rd-8th grade testers) will shrink from 26% in 2017-2018 to 21% or better in 2018-2019
Math Below Basic levels (3rd-8th grade testers) will shrink from 38% in 2017-2018 to 33% or better in 2018-2019
This starting clarity - and its widespread communication through professional development sessions, instructional team meetings, and other avenues - helped establish organizational alignment that would be critical to the success of any subsequent data program investments. In order to use data to support this goal, school leadership and EdOps focused on four data objectives.
I. Identify the right students for additional support.
The school first wanted to understand which specific students were likely to fall into the Below Basic category in 2018-2019.
To answer this question, EdOps developed a student assessment roster and analyses that looked across outcomes from monthly interims and prior-year state assessments. EdOps used historical data from these assessments to estimate the implied probability of each student earning a Below Basic score in the 2018-2019 school year. This method allowed Meadowview to look across assessments, consider what those assessments implied for each student’s performance, and make an informed judgment on who they thought was most at risk for meeting Below Basic (Exhibit 1).

Exhibit 1: Illustrative. Roster indicating implied probabilities of exam outcomes, using historical data relationships. This and other data reports helped Meadowview Charter School make proactive decisions and gauge severity of need across multiple assessments.
This method helped Meadowview use evidence, rather than perceptions, to gauge student risk levels. Additionally, combining multiple indicators into a probability of scoring Below Basic, rather than using the previous year’s state test results to label students as “Below Basic students” and “not Below Basic students,” reframed to school staff that outcomes are not predetermined; rather, it would be up to the staff’s hard work to change these outcomes for their students.
II. Use interim assessment results to isolate specific skills in order to build targeted instruction/ intervention lessons.
Meadowview, with EdOps support, used a combination of interim and state exam skill analyses to identify what the previously identified students struggled with most. By working with EdOps to drill deeper into the data for these particular students, the school was able to prioritize its focus on the skills most relevant for their success. For example, we identified that the 4th Grade Math Below Basic scoring students struggled most on Number Sense and Operations in Fractions, and that the 4th Grade ELA Below Basic scoring students struggled most with writing prompts. This information drove decisions on how interventionists would use their time to increase student learning.
III. Design progress-monitoring feedback structures so that instructional leaders could better visualize outcomes and make adjustments.
Meadowview already had a proven, skill-based interim assessment in place. School leadership recognized an opportunity to better leverage this information, which would enable them to adjust teaching more frequently during the school year. To support their academic goals, they made adjustments to both what they looked at following interim assessments and how they planned for interventions. Meadowview leadership and EdOps collaborated to create new data reporting views and meeting protocols that helped teachers remain focused on their Below Basic goals.
EdOps developed a number of new reports that helped to track progress towards goals. Of course, Meadowview couldn’t administer the annual state assessment multiple times a year to see how students were performing, so instead, following each interim round, EdOps completed an analysis showing how students were tracking toward proficiency in each standard across grades and instructors (Exhibit 2). EdOps framed the goal as a ‘gap to close’ to meet the state’s Below Basic percentage, which gave context to that number. These reports, along with others, allowed Meadowview to gauge their progress toward state test goals using projections developed from the monthly interims. This understanding of progress, in turn, allowed them to make proactive decisions and necessary adjustments to teaching and intervention.
We also collaborated to develop a new meeting protocol. Following each assessment round (i.e., data cycle), instructional leaders met with their teams to review both high-level takeaways (e.g., did we improve on the Number Sense and Operations in Fractions domain?) and student-level progress (e.g., did Student A improve in their implied performance level?). To facilitate decision-making, these meetings followed a protocol designed around key questions needed for goal attainment. For example, school leaders used this protocol to review key questions like, “which grades and instructors are furthest from goal?” rather than the less relevant “which grades and teachers performed well?” Using this protocol and the corresponding key questions enabled instructional leaders to stay grounded in the goal when reviewing data cycle information.
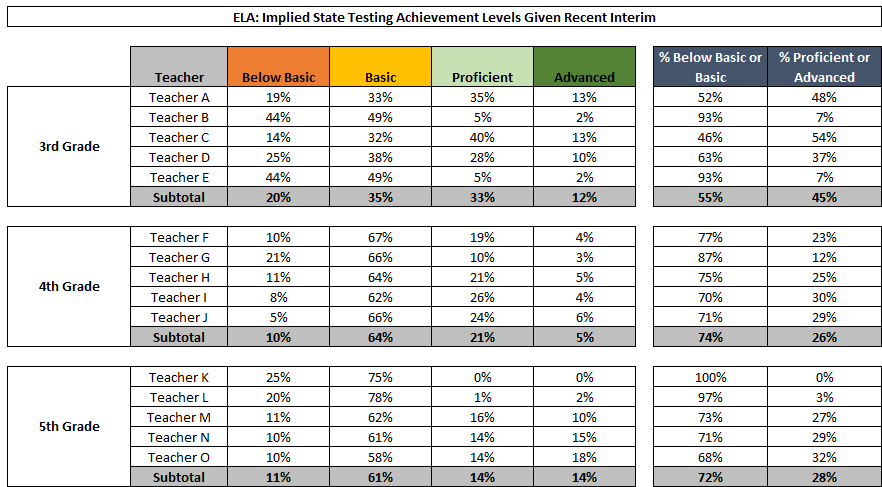
Exhibit 2: Illustrative. Table showing implied state exam outcomes given recent interim performance, organized by grade and teacher. This example, along with other newly developed reports, allowed Meadowview School to see data at the right levels to make proactive decisions.
IV. Monitor goal progress at the end of each data cycle to provide insight and accountability at all levels of the organization.
The analyses following each data cycle served dual purposes:
Improve instruction throughout the year by helping instructional leaders better understand where adjustments needed to be made.
Improve transparency and accountability around the school’s stated academic goals for the year.
EdOps helped provide this insight and transparency by providing views of the student data from a number of perspectives - at a classroom level, at grade level, and at a school building level, among others. This regular, recurring data insight provided transparency and motivation throughout the school and helped to cultivate a sense of shared ownership toward goals.
EdOps and Meadowview School Key Activities
While working toward these goals of reducing the proportion of students scoring at Below Basic in math and ELA, Meadowview Charter School and EdOps played distinct roles. The below table articulates in further detail how EdOps and Meadowview worked in partnership toward improved outcomes.

The Big Reveal: What were the results?
The school’s focus on providing additional support for students likely to attain Below Basic designation contributed to improved outcomes by the end of 2018-2019. In ELA, the Below Basic rate moved from 26% of tested 3rd-8th grade students in 2017-2018 to 16% of tested students in 2018-2019, an improvement of 10 percentage points, twice their stated goal. In Math, the Below Basic rate moved from 38% down to 34%, an improvement of four percentage points - one percentage point below their stated goal. That improvement between years is reflected below:


Exhibit 3: Meadowview Below Basic % of students fell more than the City or the State.
Data Process Learnings
A critical component of these student improvements was the consistency of action and alignment toward the goals that had been set at an organizational level. Throughout the year, school leadership remained clear in its decision that reducing the Below Basic performance level was a critical priority, and that doing so would require sustained effort. Simultaneously, their re-energized use of and investment in data provided the tools and insight needed to know how they were tracking toward that goal and when adjustments needed to be made.
The following stand out as the critical learnings gleaned from this process:
The goal itself, and the clarity and buy-in surrounding it, is critical to attainment. School leadership remained clear and focused throughout the school year that lowering the Below Basic percentage was an organizational priority. That clarity drove meetings, decisions, and the organization as a whole to focus and move in the same direction. When analyzing data or assessments, there was seldom any question of what to look at or what to discuss - rather, the goal drove alignment and those conversations proactively.
Data processes and metrics must align to a compelling purpose for students, otherwise they may feel hollow and non-motivating. As referenced at the start, school leadership committed to these improvement goals being about improving learning for individual students, not about improving some organization-level metric. Their stated purpose was to support learning for the students needing it most, and that was reflected in their decision-making. That purpose was both compelling and aligned to what educators cared about most - supporting their students and improving learning, rather than targeting tiers or groupings of students that translate to improved proficiency rates.
Analytics and assessments were critical to providing transparency, accountability, and allowing for adjustments. While the goal commitment did much of the heavy lifting, analytics and assessments helped make needed adjustments apparent, provided insight at the school, classroom and student levels, and allowed school staff to stay on track. For example, if a particular grade or instructor was tracking toward a high percentage of Below Basic students, school leadership was able to utilize the assessments’ analyses, ask questions, and allocate leader time and attention accordingly. Meadowview Charter leaders were able to ask questions and spend time wisely, in part because EdOps’s analysis was designed to bring performance to the forefront. The allocation of resources and decisions along the way were driven by real-time data.
The partnership between Meadowview Charter School and EdOps helps to illustrate how data can be used to improve academic outcomes.