
Financial Per Pupil Analysis: Why You Want It, and How You Can Do It

Effectively analyzing school financial statements across multiple years can be challenging. Changes in facilities, organizational structure, fundraising strategies, or student population (including opening or closing campuses, adding new grade levels, or experiencing demographic shifts) complicate the comparability of financials.
Per pupil analysis recognizes that student count is a key factor in understanding school financial statements. It is a simple ratio that helps schools gain insight into how much money is received and spent per student, and in this way, helps to provide a base for more complex strategic conversations as leaders analyze trends and plan for the future.
In practice, the formula can be as high-level and simple as this: total expense / number of students = per pupil spending. The analysis can also be adapted to hone in on more specific areas. For example: total recruitment dollars spent / number of new students = recruitment cost per student.
Use #1: Accurately Identify Trends in Historical Data
As mentioned above, per pupil analysis can help school leaders draw the right conclusions from changes in financial data.
Let’s use student supplies cost as an example. A quick look at the financial data below shows a 25% year-over-year increase in student supply expense – a potentially alarming trend:
Total Student Supplies Spending by Year

But if we account for the fact that enrollment grew from 344 to 420 students, the change in spending on a per-student basis starts to look far less extreme. In fact, spending per student has increased less than 3%:
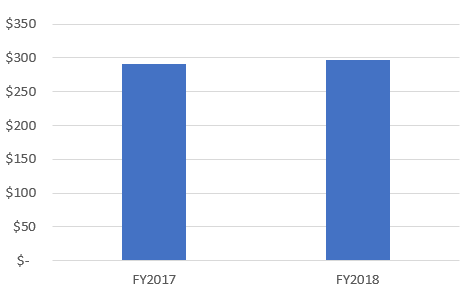
Per Pupil Student Supplies Spending by Year
By performing a per student analysis, schools wanting to dig deeper into this spending are equipped to have more meaningful conversations with vendors and other stakeholders as they craft an updated strategy for their schools.
Use #2: Plan for the Future
Per pupil analysis is an important tool for creating budgets or multi-year forecasts. In addition to being used to index revenue and expense line items to account for changes in student population, it can also help to highlight areas of efficiency or concern. For example, student transportation may be more costly on a per student basis if the school has multiple buses that are not full. This per student cost data can shape larger operational conversations around whether the bus routes need to be evaluated for efficiency. The analysis can also provide insight for a school evaluating future expenditures, such as upgrading facilities. Because revenue is so closely tied to student count, the school will need to calculate the per pupil cost of a new facility to evaluate whether it is affordable, especially if the new facility is not immediately at capacity.
Use #3: Compare to Regional Averages
How do school leaders know how their spending compares to other schools? As with identifying trends, comparing total expenses could be misleading if the comparison schools are much smaller or much larger than the school to which they are being compared. Per pupil analysis, however, provides a means for schools to effectively benchmark their financials against district, state, and national averages, highlighting any areas that deviate greatly from regional trends. Identifying these deviations will necessarily raise questions about the underlying cause. Is a school overspending on student supplies because of inefficiencies in supply ordering, or does the school’s program require more specialized and costly supplies? Strategic, intentional decisions may drive higher or lower spending in certain categories. A per-pupil analysis can help schools identify areas where they differ from the sector so leaders can decide whether the difference is intentional and to be maintained, or accidental – and to be remedied.
[This post contributed by Karianne Chassee, Regional Manager (Louisiana)]